Shonan Bellmare utilized their wingbacks, Hirokazu Ishihara (#3) and Taiga Hata (#26), in different ways in their 0-2 Round 16 loss to Cerezo Osaka.
This quick article will share a few datapoints showing the different roles for each player in this match.
The image below shows Shonan Bellmare's lineup, a 3-1-4-2 that appears to have been used for every single J1 match since the start of the 2020 season (per Transfermarkt).
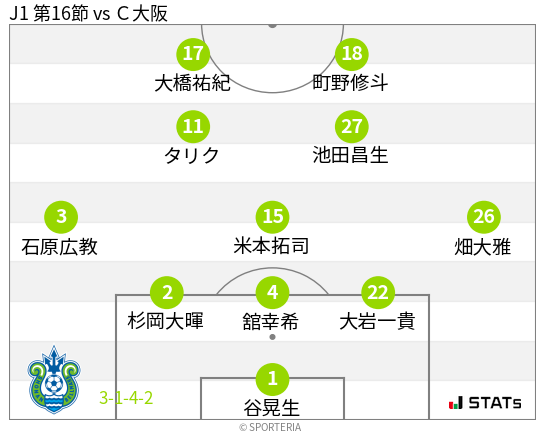
As the lone wide players, with two midfielders in front of a holding midfielder and behind two strikers, the wingbacks will naturally be involved in every Shonan Bellmare move down the flanks. This shape also will allow for some fluidity, with upwards to 5 players near the flank or in the half space if the wide center back pushes up and the holding midfielder cheats to one side.
We can see the importance of the wingbacks when we dive into Shonan Bellmare's sonar passing charts below.
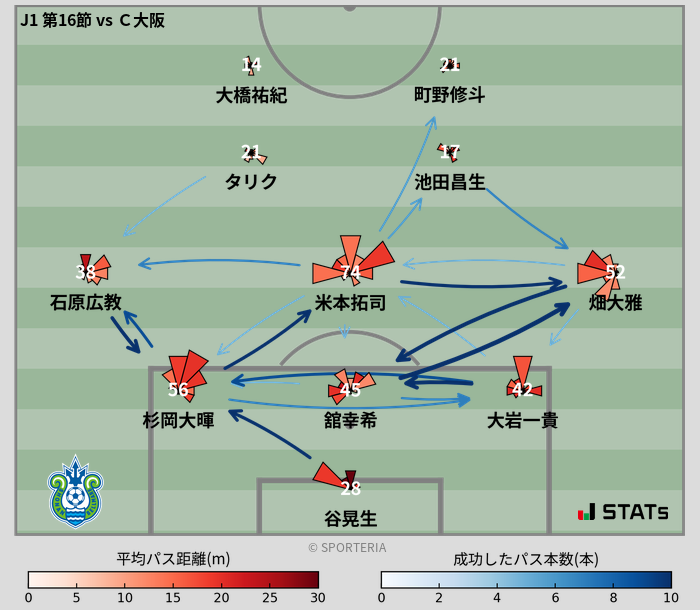
- The length of each "slice" represents the number of passes in that direction
- A darker red color represents a longer average pass length in that direction
- A darker blue color represents a higher number of passes between two players
Taiga Hata attempted 52 passes, the 3rd-most of the squad. Compare this with Ishihara's 38, the 6th-most of the squad, and we can start seeing that Hata was used more frequently, and thus the right flank, than Ishihara and the left flank.
The image below will allow us to start visualizing Hata and Ishihara's different usages in more detail. This image shows the pitch divided into 30 rectangles, with the arrows between the rectangles representing the number of passes between each area. A darker color represents more passes.
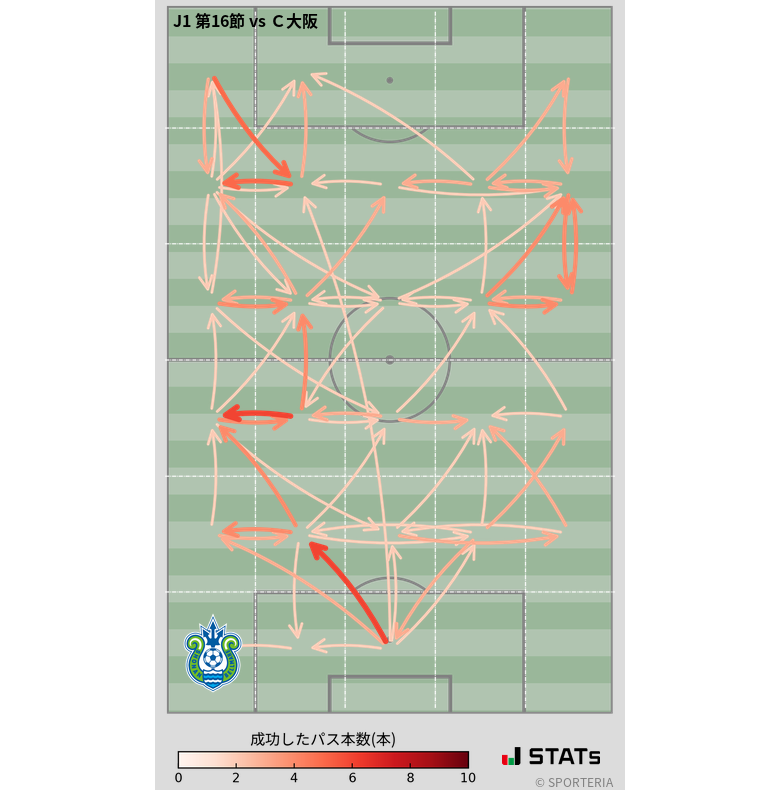
This image illustrates Shonan Bellmare's passing patterns. We can see that the goalkeeper typically passed to the left center back rather than one of the other two (and that shows up on the sonar chart above as well). We can also see differences on the flanks.
The left flank was used more in the defensive half and then for cutbacks to the top of the box. the right flank, on the other hand, appears to have been used more to get the ball into the final third, rather than in buildup like the left flank.
That point is proven with the data as well when we look at the passing locations and heatmaps of each wingback in tandem with the central midfielder on their flank.
Right Flank
- 畑 大雅 Taiga Hata, left map
- 池田昌生 Masaki Ikeda, right map
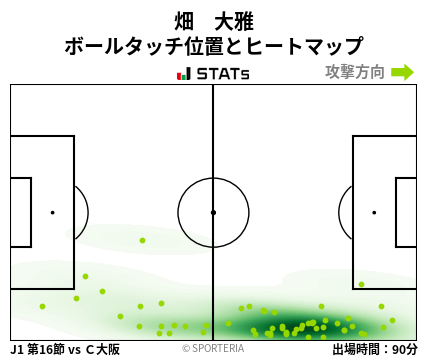
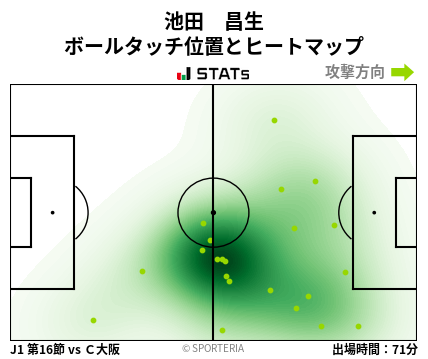
First, let's look at the right flank. The heatmaps of both these players backs up what the other data told us, that the right flank was used more often at the beginning of the final third than in buildup.
The pass flow chart above showed that play typically flowed from the GK to the LCB then into the DM before reaching Masaki Ikeda, who then passed to Hata between midfield and the box. We can see that clearly when we consider both flow chart and heat map at the same time.
Also notice how consistent both players' positions tend to be when they pass the ball. Hata is very close to the touchline and right at the final third, while Ikeda is right on the halfway line just outside the center circle.
And as the other data we've seen so far showed, we'll see something different with our players on the left flank.
Left Flank
- 石原 広教 Hirokazu Ishihara, left map
- タリク Tarik Elyounoussi, right map
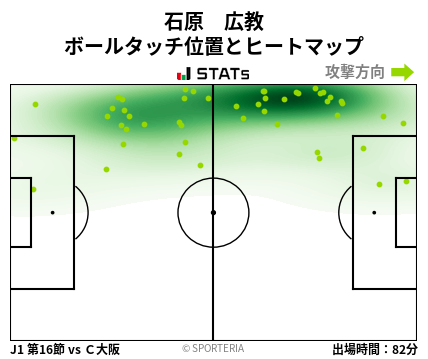
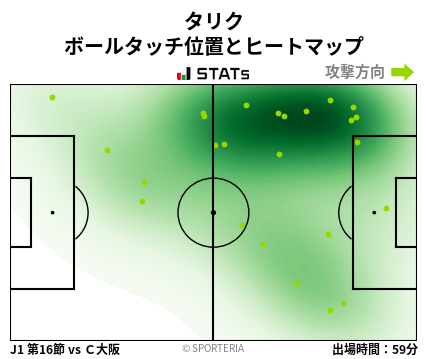
We immediately see how much less consistent these players' positions are when they passed. Ishihara had almost half his passes in the defensive third, and many more passes in that area than Hara, who had just a few passes in the defensive third. Elyounoussi was also much less consistent in his passing position than Ikeda was.
These maps also help to back up the passing flow analysis, that there were several areas on the left flank with plenty of passes between them.
So, overall we can see the different roles that Shonan Bellmare's wingbacks had in this match. Down the left, Hirokazu Ishihara was tasked with being involved in most facets of play, but not as frequently as his counterpart Taiga Hata. Hata was tasked more with getting the ball into final third and crossing as opposed to circulating it around the pitch.
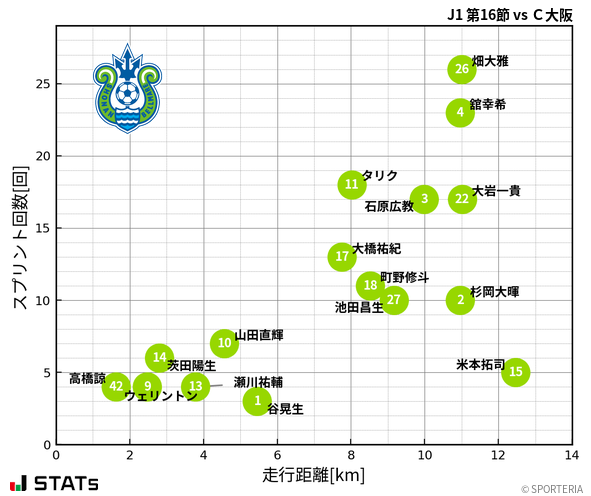
The scatterplot below shows the kilometers covered on the x-axis and number of sprints on the y-axis. Both wingbacks covered close to the same total distance, but Hata (#26) had 9 more sprints than Ishihara (#3), and the most of the whole team. That further shows his role of running down the flank to get the ball into the final third instead of being relatively more involved in circulation, which would involve fewer sprints.
The gif below shows Shonan Bellmare's pass map in 15 minute intervals. In 4 of these 6 intervals, Hata is, on average, higher up the pitch than Ishihara when receiving the ball. In fact, from 60' to 75', Hata was on average the highest up the pitch of all Shonan Bellmare players when he received the ball! While Ishihara was also the highest up the pitch in the first 15 minutes of the game, he was much less involved during those 15 minutes than Hata was in the 60'-75'.
Hopefully, all these event data graphs show that the wingbacks had very different roles, and that my explanations were able to explain what those were.
The final bit of information to throw at you all is each players' match stats.
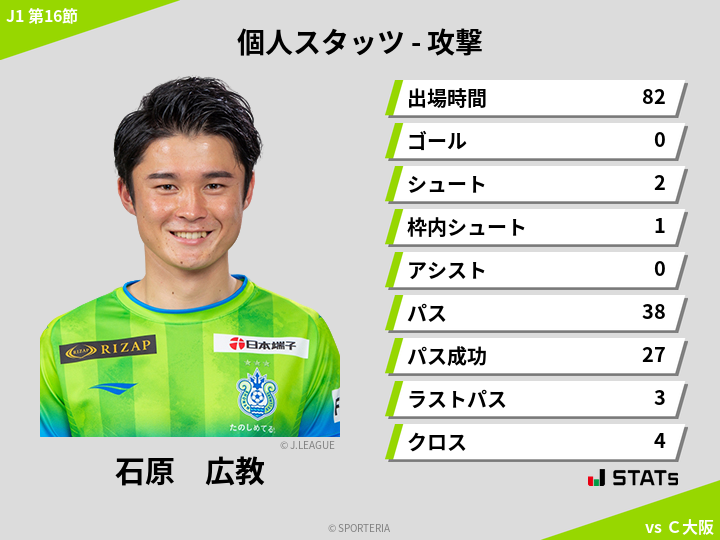
Hirokazu Ishihara
The stats are, from top to bottom:
- Minutes played (82)
- Goals (0)
- Shots (2)
- Shots on target (1)
- Assist (0)
- Attempted passes (38)
- Completed passes (27)
- Passes leading to shots (3)
- Crosses (4)
Taiga Hata
- Minutes played (90)
- Goals (0)
- Shots (0)
- Shots on target (0)
- Assist (0)
- Attempted passes (52)
- Completed passes (34)
- Passes leading to shots (3)
- Crosses (14)
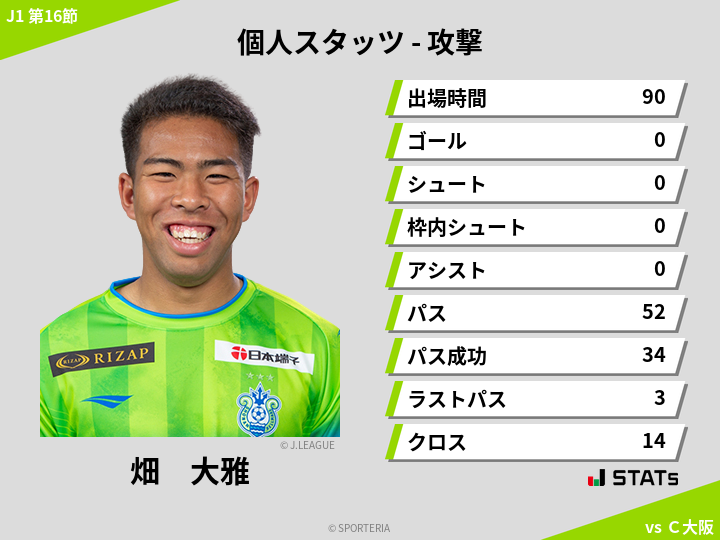
While both players had the same number of passes leading to shots, Hata had 10 more crosses than Ishihara. 27% of Hata's passes were crosses, compared to 11% of Ishihara's.
Final Thoughts
Shonan Bellmare had very different roles for their wingbacks in their recent loss against Cerezo Osaka. Taiga Hata, the right wingback, was tasked with sprinting up the flank and getting the ball into the final third, often by crossing. Hirokazu Ishihara, the left wingback, was tasked more with being a constant presence on the lesser-used left flank, both in buildup as well as ball circulation further up the pitch.
A special thanks to Sporteria for making all this information readily available and free to use. This is partially an experimental post II'm writing to get a feel for what data they have available and how to use their blogging format (the only way to use/share their data, if I understand their terms of use correctly). There's some great data and ready-made graphs in here, so I'm excited to keep learning how to use it all!
An extra bit of data
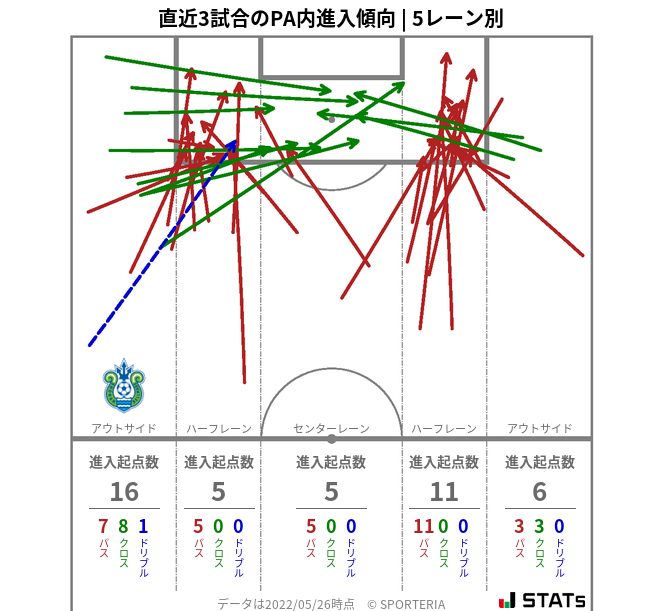
The graph below shows all the entries into the penalty box Shonan Bellmare have had in the 3 games leading up to this match against Cerezo Osaka. Using the flanks to pass or cross the ball into shooting areas is absolutely the norm for Shonan Bellmare, and was seen again in this match, albeit mainly from the right flank instead of both.
- Red = Pass
- Green = Cross
- Blue = Dribble/run


コメント(5)
-
 SPORTERIAスタッフ
2022/6/9 22:36
Thank you for your very interesting analysis and insight !
SPORTERIAスタッフ
2022/6/9 22:36
Thank you for your very interesting analysis and insight !
-
 SPORTERIAスタッフ
2022/6/9 22:37
26-HATA in particular is a very dynamic player and a promising prospect who has a strong presence in both attack and defense.
SPORTERIAスタッフ
2022/6/9 22:37
26-HATA in particular is a very dynamic player and a promising prospect who has a strong presence in both attack and defense.
-
 SPORTERIAスタッフ
2022/6/9 22:37
The more often Shonan's wingbacks touch the ball in high areas, the more likely it is that one indicator that their strategy is working.
SPORTERIAスタッフ
2022/6/9 22:37
The more often Shonan's wingbacks touch the ball in high areas, the more likely it is that one indicator that their strategy is working.
-
 SPORTERIAスタッフ
2022/6/9 22:37
We SPORTERIA will continue to provide more data and materials so that more people can enjoy sports analytics.
SPORTERIAスタッフ
2022/6/9 22:37
We SPORTERIA will continue to provide more data and materials so that more people can enjoy sports analytics.
-
 Ben Griffis
2022/6/9 22:44
Thank you for all the great work! And Hata does look really promising, it should be interesting to watch him develop even more!
Ben Griffis
2022/6/9 22:44
Thank you for all the great work! And Hata does look really promising, it should be interesting to watch him develop even more!
For Shonan Bellmare, think wingback is traditionally an important position to differentiate themselves tactically from their opponents.
(I see he is playing in the U-23 Asian Cup match that is going on right now.)
I hope you will continue your interesting contributions, thanks !