Tokyo Verdy and Iwate Grulla Morioka drew 2-2 in their Round 22 encounter, but the final score doesn't show the on-ball dominance of Verdy. With 532 passes compared to Grulla's 132, Verdy had 80% of the total passes and 65% of the total live-ball possession.
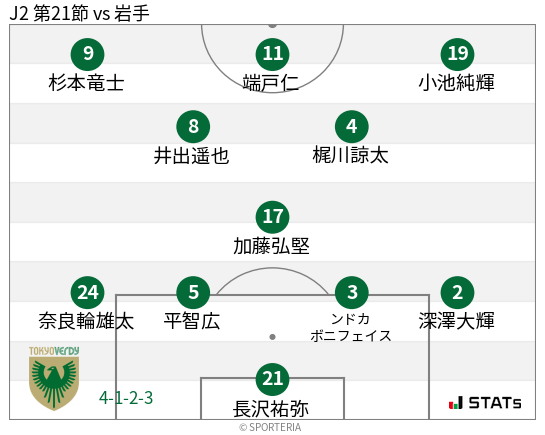
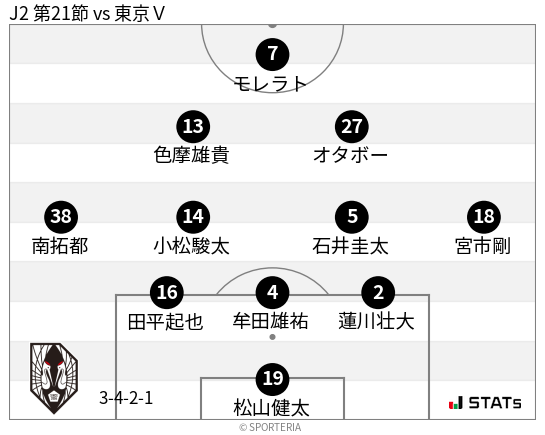
Here's how the teams lined up:
Even though they had ample passes, Verdy struggled to turn their passes and possession into shots. Verdy took just 12 shots compared to Grulla's 15. Shots on target were equal, with both clubs recording 9. Grulla were content with Verdy passing amongst their defenders, as they were relatively strong at repelling the relatively infrequent attacks on their box.
The metrics, from top to bottom:
- Goals
- Shots
- Shots on target
- Penalties
- Successful passes
- Corners
- Free Kicks
- Ball Possession (time%)
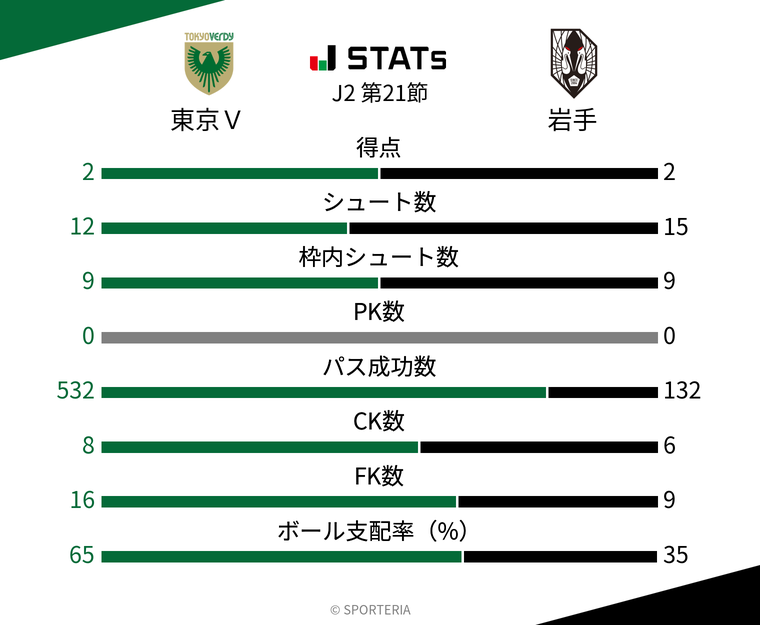
As we can see above, most of the match's stats don't heavily favor Verdy, except for passes and possession.
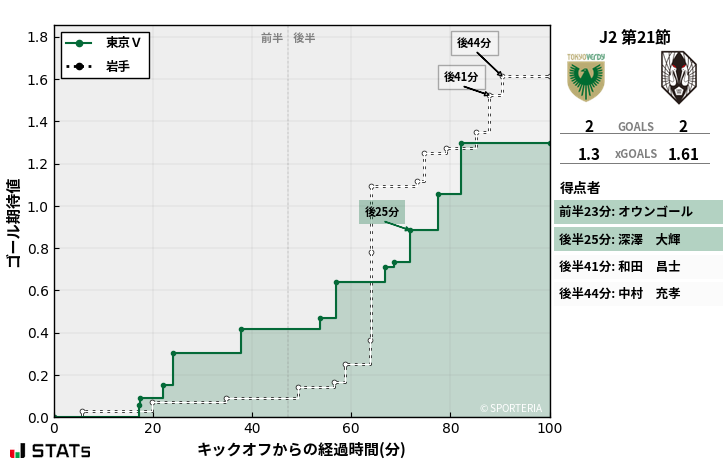
Here is the running xG plot for this match. Without watching the match, it may be difficult to see how much Verdy dominated the ball. Of course, they had fewer shots than Grulla, but the times between each teams' shots is fairly even as well. When Grulla broke with the ball, they tended to get a shot off. The same cannot be said for Verdy. If they could have tested Grulla's keeper Kenta Matsuyama more often, they probably would have won the match.
The passing sonar charts also don't look good for Verdy in this match when we compare theirs to Grulla's. Let's look at Verdy's first.
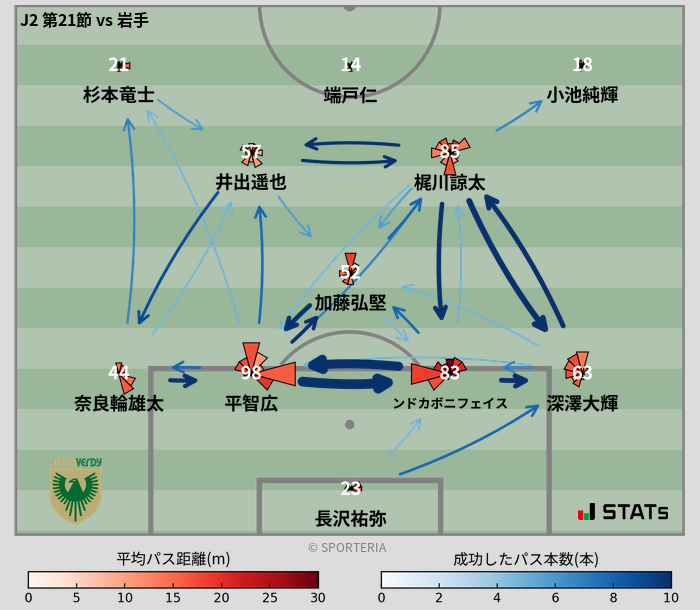
- The length of each "slice" represents the number of passes in that direction
- A darker red color represents a longer average pass length in that direction
- A darker blue color represents a higher number of passes between two players
We can see just how many passes the center backs had, 181 in total. But take a look at how scant the connections are between the front 3, particularly the striker Jin Hanato and right winger Junki Koike. This further cements Verdy's inability to turn their passes and possession into anything useful.
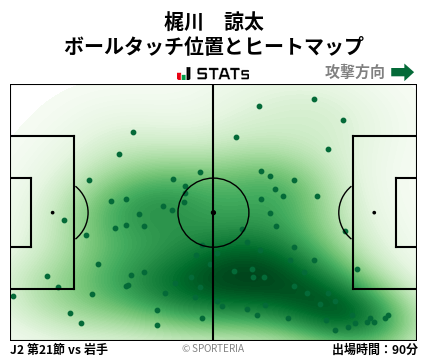
Looking at their right attacking midfielder, Ryota Kajikawa, also paints a depressing picture for Verdy fans. Kajikawa, even though he could be found across the pitch (see his touch map below), had the 2nd-most passes of any player in the game. But Verdy couldn't capitalize with the ball in advanced spaces with him.
Ryota Kajikawa's touch map
Next, compare Verdy's passing sonar above with Iwate Grulla Morrioka's below:
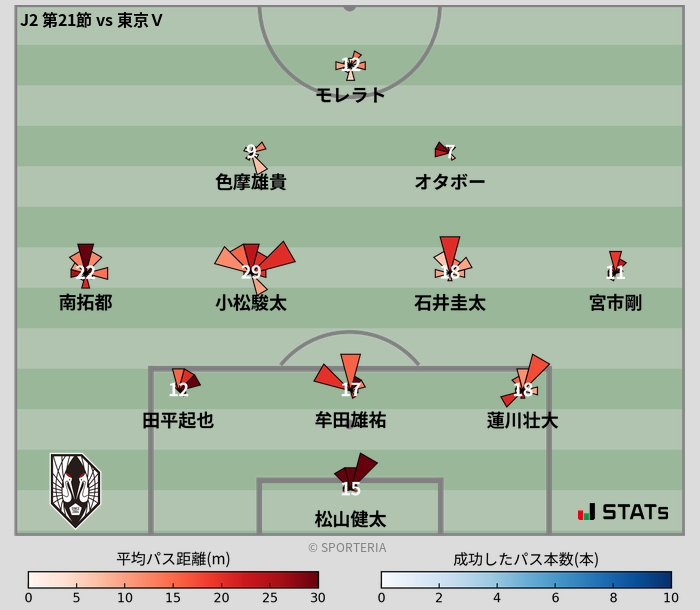
Stark difference. Not a single Grulla player has a strong connection like Verdy's players have.
Their player with the most passes, LCM Hayata Komatsu, had just 29. That would rank him 8th on Verdy's squad. But, as we saw in the xG chart, Grulla were still able to make good use of their possession and passes, especially when we compare them to Tokyo Verdy.
The next two images show Verdy and Grulla's passing networks in 15 minute intervals. Even without a detailed analysis, they solidify two things:
1) That Verdy were by far the most dominant team on the ball, and
2) That Verdy couldn't capitalize on their often advanced possession
And something else that Grulla's networks show is their ability to get the ball far out of their own half when they got the chance. Most of their passing networks have the majority of their players' average receiving location in Verdy's half. That's very difficult to do when your team is being pinned back by the opponent's possession all match.
Here's one example of Grulla's ability to quickly and effectively get the ball out of their half when they win it.
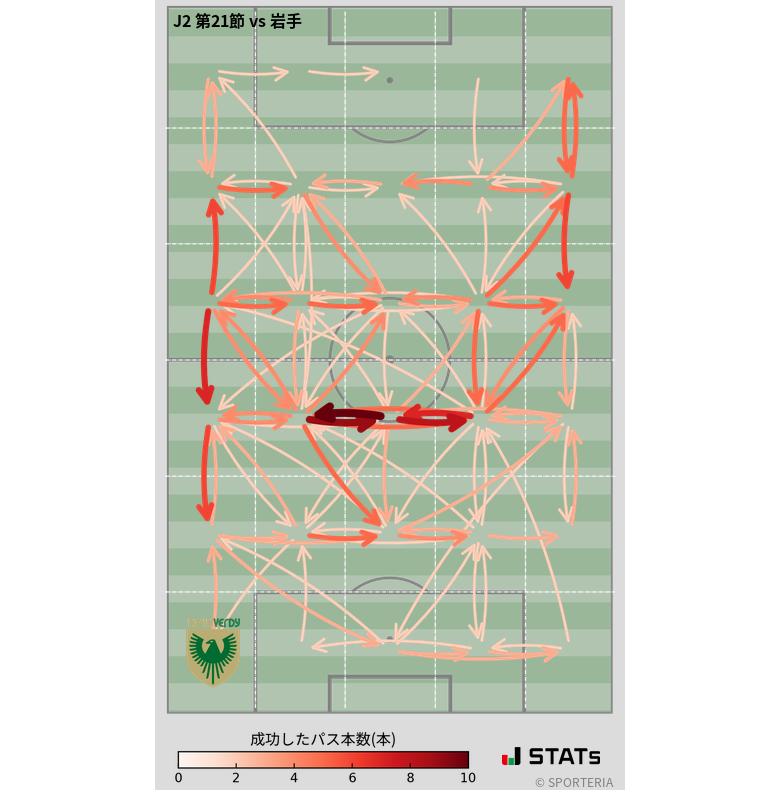
That point is also backed up by Grulla Morioka's passing flow chart. This chart shows the pitch divided into 30 rectangles, with the arrows between the rectangles representing the number of passes between each area. A darker color represents more passes
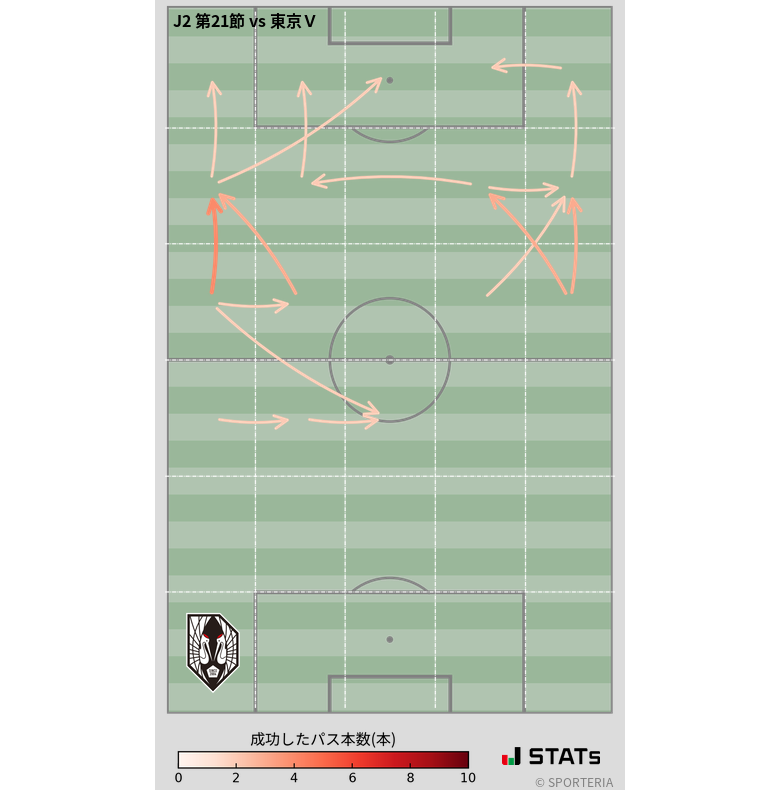
Most of their passes flowed from an area in Verdy's half to another area in Verdy's half. Again, it must be stressed that this was vital to them not being overwhelmed all match. When they won the ball, they effectively and decisively cleared it out of their half, and typically got a shot off. This relief allowed them to stay dangerous with the ball all match, enabling them to earn a (most likely deserved) draw for their efforts.
Looking at Tokyo Verdy's pass flows are somewhat less interesting, as they show us further that they dominated all areas of the pitch.
We can see, however, how much Verdy used the wings for their attacks, after building up with their center backs. In my preview of this match, I highlighted Verdy's use—and typical danger from—their flanks. This match was no exception, with both goals coming from wide creations.
Verdy's first goal, an own goal, came into the mixer from a cross from the left:
And here's Verdy's 2nd goal, which came from a cut inside from the left wing by the electric Mizuki Arai:
Both goals coming from the left is only natural for Verdy, who as we saw in my preview, love using the left flank more than the right.
The final data points from this match I want to illustrate are several players' touch maps. We've already seen Ryota Kajikawa's above, with many touches all over the pitch, but focused right around the final third.
Let's now look at Verdy's center backs, which complete Verdy's top 3 players for touches.
Boniface Nduka:
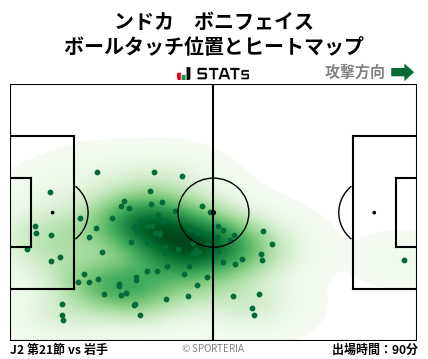
Tomohiro Taira:
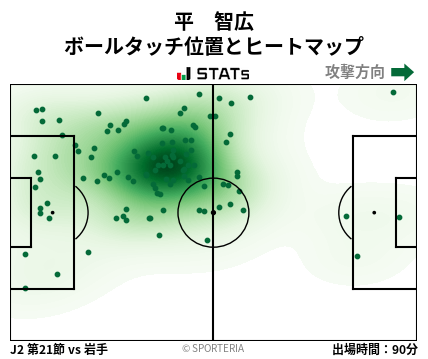
We can see how high up the pitch both center backs typically were with their touches. Sitting at the level of the base of the center circle, they helped to enable Verdy's ball circulation in Grulla's half. But of course, as I've tried to show using all the other data, Tokyo Verdy weren't very effective with their possession.
The next player I want to show is halftime substitute Verdy's #10, Mizuki Arai:
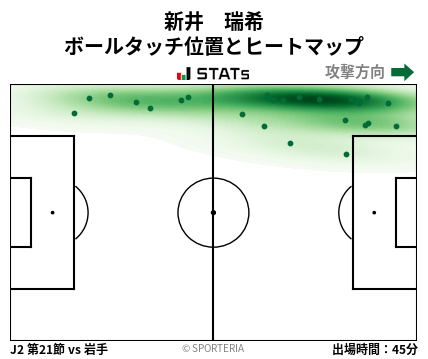
Arai is a central player to Tokyo Verdy whenever he is on the pitch. Play flows through him and his technical skills allow him to create space for himself, and he's got quite the cross in him. We can see that today both in Verdy's second goal as well as his touch map. Lots of touches for a player who only played half the match, and the majority of them came in the final third.
The final Tokyo Verdy player I want to call out is their defensive midfielder, Koken Kato.
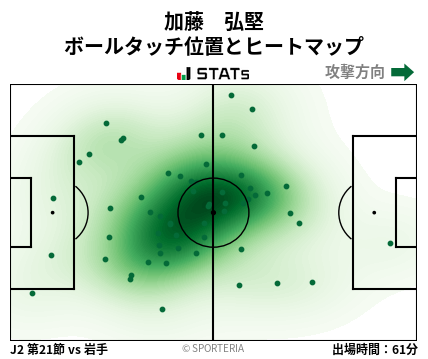
Kato was a key player for Verdy's movement around the pitch. He could be found anywhere, providing an open option for a pass. He preferred to stay central in order to switch play from flank to flank, but would help out on each flank's half-space as needed.
For Iwate Grulla Morioka, one player in particular that I want to call out is their attacking midfielder who played the majority of the match, Yuki Shikama.
Shikama had 7 of his 13 touches in Verdy's half, which helps to show how even though Grulla were typically pinned back, they were able to effectively break the halfway line to relieve pressure for even a short time.
Another player from Grulla with an important touch map to add richness to this analysis if their replacement striker, Atsutaka Nakamura.
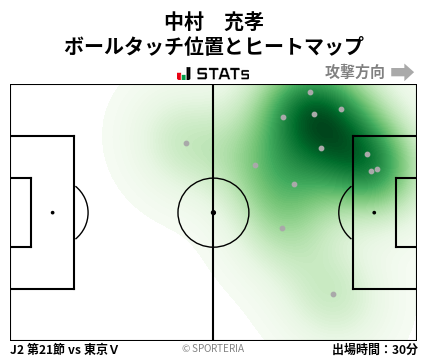
Just one touch in Grulla's half. For a striker in a side being pinned back, that is impressive. He wasn't used as the outlet to get the ball out of Grulla's half, but rather was able to get the ball after one of the wide players moved the ball into the attacking half (much like how we saw in the video earlier where Grulla used a couple wide players to get the ball into the final third from their defensive third).
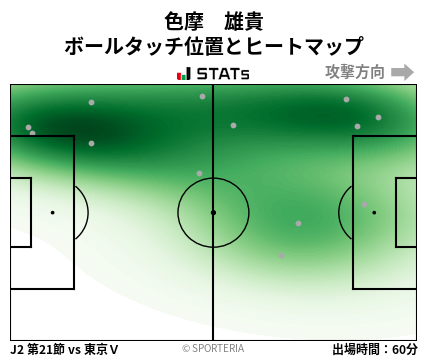
Finally, let's look at Takuto Minami, who switched from being the left wingback to the right wingback after halftime.
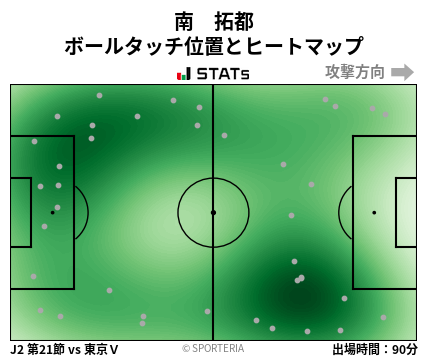
Compare the location of his touches on each flank. In roughly the first half, most of his touches were deep in his own half. After switching to the right flank, we can see how his touches were much higher up the pitch. This is a great visualization for what I've been saying: Grulla were effective at leaving their half. Either through accurate long balls or runs from deep, they were able to push up and out when given the opportunity.
During the second half, and especially near the end of the match, Grulla Morioka were pushing even higher and seemingly more often. Even when they were down 2-0, which is typically rare for a team in the bottom of the table losing by two goals late in the match. This pushing up, paired with their ability to get into Verdy's third and shoot when they got the ball, allowed them to earn a very late draw, with goals in the 86th and then 89th minutes.
Final Thoughts
Tokyo Verdy were by far the most dominant team, however Iwate Grulla Morioka were certainly more effective when they got the ball. The match, between two teams in relatively poor form near the bottom of the table, was exciting and lived up to the pre-match excitement that I know I had after previewing this match earlier in the week.
Verdy's inability to capitalize on their possession and inability to stop Grulla's counters out of their own half allowed their opponents to stay in the game, even at 2-0 down. A few great opportunities at the end earned Grulla a deserved draw on the night, as while they didn't have much possession, they were very effective with their possession. Coupled with some exciting passages of play from Verdy's passes and Mizuki Arai's skills on the left flank in the second half, it's difficult to see that both these teams are in the bottom third of the J2 table after 21 matches.
Follow this link to watch the full match on J League's international YouTube channel.


コメント(4)
-
 SPORTERIAスタッフ
2022/6/13 14:25
Thank you for writing such a detailed review, and in such a short time after the game !
SPORTERIAスタッフ
2022/6/13 14:25
Thank you for writing such a detailed review, and in such a short time after the game !
-
 SPORTERIAスタッフ
2022/6/13 14:26
According to the post-match comments by Grulla's coach Yutaka Akita, their plan was to go on the defensive in the first half and then go on the offensive in the second half, and that is exactly what happened in the game.
SPORTERIAスタッフ
2022/6/13 14:26
According to the post-match comments by Grulla's coach Yutaka Akita, their plan was to go on the defensive in the first half and then go on the offensive in the second half, and that is exactly what happened in the game.
-
 SPORTERIAスタッフ
2022/6/13 14:28
Of course, losing the first two goals was unexpected, and they had some bad luck, such as shots hitting the post/bar, but I think their mentality was great 👏
SPORTERIAスタッフ
2022/6/13 14:28
Of course, losing the first two goals was unexpected, and they had some bad luck, such as shots hitting the post/bar, but I think their mentality was great 👏
-
 SPORTERIAスタッフ
2022/6/13 14:30
For Verdy, it resulted in missing the three-point story, but I hope they will make the most of it in the future as a game that showed both their strengness and weaknesses.
SPORTERIAスタッフ
2022/6/13 14:30
For Verdy, it resulted in missing the three-point story, but I hope they will make the most of it in the future as a game that showed both their strengness and weaknesses.
It seemed to bring back the excitement of watching the game.
The contrast between Verdy's domination in the first half and Grulla's defiance in the second half was amazing 💡
https://www.jleague.jp/match/j2/2022/061206/live/#coach
This game was the first time in J2-League that Grulla came back from two goals behind to tie .
Thanks for the exciting match ⚽